One of the problems, or challenges, if you prefer, with medicine is that few people who become doctors do it because they love science. They become doctors typically because they want to help people, a very fine reason. But this means that when the situation calls for a more scientific examination of the evidence before them, or of the value or pertinence of this or that finding or practice, your doctor is likely operating at a disadvantage.
Ultimately, tradition, law, and their insurance companies all but force them to stick to conventional, approved approaches to everything. In general, this is not a bad thing – you certainly don’t want your doctor freestyling it when it is your health on the line. If doctors everywhere treat a given constellation of symptoms in a particular way, that would probably be the place to start. But it’s not in itself science.
I recall a couple decades ago that every time we took a kid to the pediatrician – and we loved our pediatrician – she would feel compelled to advise us not to let the little ones sleep with us, family bed style. I can just hear her teachers, or her professional bulletins or her insurance company telling her it was best practice, that kids die every year smothered in a bed with an adult, and just don’t do it. Now, of course, pediatricians in the US (it was never policy in the rest of the world) have come to realize that the benefits to both the child and the parents of having the child in the parent’s bed far outweigh the miniscule risks. Such risks effectively disappear if the child and parents are healthy and the parents sober, while the sense of comfort and attachment gained by the child and the extra sleep gained by the parents is a serious win-win.
Now a scientifically inclined person might ask about the data and methodology behind the claim that hundreds of thousands of years of natural selection had somehow gotten the whole baby sleeps with parents thing wrong. Maybe it has – but the issue should have at least been addressed. But it wasn’t, in America, at least up until a few years ago. So every American pediatrician was expected to toe the official line, and our doctors did. For, what if you hadn’t advised parents against ‘co-sleeping’ and a baby died? You’d be asking for a lawsuit.
Another example I’ve mentioned before is salt intake. This one is a little different, in that for some people, there seems to be a fairly strong correlation between salt intake and blood pressure, so at least being concerned about it isn’t crazy.
For most people, however, there is little or no correlation between salt intake and blood pressure, at least within realistic levels of consumption. In one of the earliest studies, rats were given the human equivalent of 500g of salt a day, and their blood pressure shot right up! But humans tend to consume around 8.5g of salt a day. Um, further study would be indicated?
The science would seem to support some degree of caution regarding salt intake for people with high blood pressure. Instead, what we get are blanket recommendations that everybody – everybody! – reduce salt intake. It will save lives! Medicine cries wolf. People learn to ignore medical advise. Further, Medical Science! fails to consider what it is asking for – a complete overhaul of people’s diets. Few real people are going to do this without serious motivation. Wasting ammo on a battle not worth winning.
Again, if doctors were essentially scientists attracted to medicine for all the opportunities for scientific discovery human health presents, such errors and poor judgement might be more limited. But doctors became doctors to help people, not to debate scientific findings with them. They want to DO something. Thus, conventional medical practice is full of stuff to do for every occasion. Whether or not there’s really any science behind it is not as important, it seems, as developing practices to address issues so that medicine itself can be practiced. Clearly, for the average doctor, having *something* to do is better than having nothing to do, even when that something isn’t all that well supported or even understood.
These thoughts are on my mind because of all the trouble I’m having with blood pressure medicines at the moment. Since there’s an obvious trade-off here – somewhat higher blood pressure with a higher quality of life versus acceptably lower blood pressure but with lower quality of life – I decided I needed to do a little basic research. Here’s where I’m at after a very preliminary web search:
What I’m looking for, and have so far failed to find, is a simple population level chart, showing the correlation between blood pressure and mortality/morbidity. Of course, any usefully meaningful data would be presented in a largish set of charts or tables, broken out by such variables as age, sex, and body mass index. But I would settle at this point for any sort of data at all, showing how much risk is added by an additional 10 points or 10 percent, or however you want to measure it, above ‘normal’ blood pressure.
For example, I’m a 60 yr old man. Each year in America, some number of 60 year old men drop dead by high blood-pressure-related illnesses. OK, so, base data is at what rate do 60 year old men drop dead from high blood pressure related diseases? Let’s say it’s .1% (just making up numbers for now) or 1 out of every 1,000 60 year old men. That’s heart attack and stroke victims, with maybe a few kidney failures in there, severe enough to kill you, a 60 year old man.
Now we ask: what effect does blood pressure have on these results? Perhaps those 60 year old men running a 120/80 BP die at only a .05% rate – one out of every 2,000 drops dead from heart attacks, strokes or other stray high BP related diseases. Perhaps those with 130/90 (these results and possible ages would be banded in real life most likely, but bear with me) die at .09% rate, while those with 150/100 die at .2% rate, and those above 150/100 die at a horrifying 1% rate, or 10 times as much as the old dudes with healthy blood pressure. These numbers would all need to average out to the .1% across the population, but a high degree of variability within the population would not be unexpected.
Or maybe something else entirely. But I have yet to find such charts. I’ve found interesting tidbits, like FDR’s BP in 1944 when his doctor examined a by that time very ill president “was 186/108. Very high and in the range where one could anticipate damage to “end-organs” such as the heart, the kidneys and the brain.” So I gather BP in that range is very bad for you, or indicates that something else very bad for you is going on (FDR had a lot of medical issues and smoked like a chimney).
Then there’s this abstract, suggesting in the conclusion that my quest is going to be frustrated:
Abstract
Objectives
Quantitative associations between prehypertension or its two separate blood pressure (BP) ranges and cardiovascular disease (CVD) or all-cause mortality have not been reliably documented. In this study, we performed a comprehensive systematic review and meta-analysis to assess these relationships from prospective cohort studies.
Methods
We conducted a comprehensive search of PubMed (1966-June 2012) and the Cochrane Library (1988-June 2012) without language restrictions. This was supplemented by review of the references in the included studies and relevant reviews identified in the search. Prospective studies were included if they reported multivariate-adjusted relative risks (RRs) and corresponding 95% confidence intervals (CIs) of CVD or all-cause mortality with respect to prehypertension or its two BP ranges (low range: 120–129/80–84 mmHg; high range: 130–139/85–89 mmHg) at baseline. Pooled RRs were estimated using a random-effects model or a fixed-effects model depending on the between-study heterogeneity.
Results
Thirteen studies met our inclusion criteria, with 870,678 participants. Prehypertension was not associated with an increased risk of all-cause mortality either in the whole prehypertension group (RR: 1.03; 95% CI: 0.91 to 1.15, P = 0.667) or in its two separate BP ranges (low-range: RR: 0.91; 95% CI: 0.81 to 1.02, P = 0.107; high range: RR: 1.00; 95% CI: 0.95 to 1.06, P = 0.951). Prehypertension was significantly associated with a greater risk of CVD mortality (RR: 1.32; 95% CI: 1.16 to 1.50, P<0.001). When analyzed separately by two BP ranges, only high range prehypertension was related to an increased risk of CVD mortality (low-range: RR: 1.10; 95% CI: 0.92 to 1.30, P = 0.287; high range: RR: 1.26; 95% CI: 1.13 to 1.41, P<0.001).
Conclusions
From the best available prospective data, prehypertension was not associated with all-cause mortality. More high quality cohort studies stratified by BP range are needed.
Ok, so here is some information. Let’s chart it out as best we can. Here is the diagnostic banding used by the medical profession here in the US. I note it is unadjusted for age or anything else, which is fine, got to start somewhere:
- Normal blood pressure – below 120 / 80 mm Hg.
- Prehypertension – 120-139 / 80-89 mm Hg.
- Stage 1 hypertension – 140-159 / 90-99 mm Hg.
- Stage 2 hypertension – 160 / 100 mm Hg or higher.
The meta-study above further divides the prehypertension range into a high and low as follows:
- Low Prehypertension – 120–129/80–84 mmHg
- High Prehypertension – 130–139/85–89 mmHg
This particular study does nothing with Stage 1 and 2 hypertension – too bad. But it’s mostly those prehypertension numbers I’m worried about personally. Anyway, here’s what we’ve got so far.

We will here ignore what looks like a bit of statistical hoodoo – we’re blending different studies, calculating p-values and confidence intervals to the combined results – um, maybe? Perhaps if Mr. Briggs or Mr. Flynn drops by, they can give a professional opinion. Me, I’m just – cautious. So, what’s this telling us?
If I’m reading it correctly – not a given by any stretch – we’ve determined the total relative risk or RR (a term of art, but sorta means what it seems to mean) at the base state and the three partially overlapping prehypertension states based on both systolic and diastolic BP ranges, both on a ‘All Causes’ and a cardiovascular diseases basis. What this appears to say is that a meta analysis of 13 studies of nearly a million people over several decades shows that your risk of illness from any cause increases .03 RR points, or 3% over the base value, if your BP runs a little high, but that your risk of cardiovascular disease increases 32%. Which doesn’t exactly make sense if one assumes cardiovascular diseases are part of ‘All Causes’ – and why wouldn’t they be? – unless slightly high BP somehow reduces the sum of all other risks. Also, the analysis run over the two sub-ranges of low and high prehypertension do not look like they could possibly add up to the values over the entire prehypertension range – which could well be an artifact of the statistical analysis used. If that is the case, does not logic indicate that the results are quite a bit less certain than the p-values and confidence intervals would suggest? Again, I am very much an amatuer, so I could be a million miles off, but these are the questions that occur to me.
The critical piece missing for my purposes: what scale of risk does the RR here represent? A 32% increase in a .01% chance of Bad Things Happening is hardly worth thinking about; a 32% increase in a 20% risk of Bad Things is a whole ‘nuther kettle of fish.
I’m about researched out for the moment, will continue to google around for more information when I get a moment.
UPDATE:
Is it obvious enough that I’m a LITTLE COMPULSIVE? Just found this, at the Wiley Online Library:
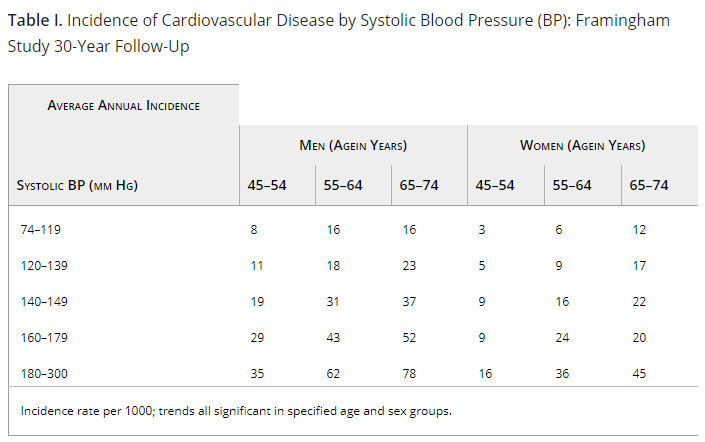
Don’t know if this is annualized (per year) numbers, or a total across the entire age range, that ‘all significant’ part worries me a little, but: this seems to be saying that I, a 60 year old man, could expect a 1.8% chance of cardiovascular disease (however that’s defined) if my blood systolic blood pressure falls between 120 and 139, or, more important to my purposes, minisculely more risk than if my BP was the more desirable 120.
This is in line with what one would expect from the data in the previous chart.
Still a lot more work to do here.


 Next, the flash fiction has now stopped being flash fiction, in the sense that instead of each ‘chapter’ merely being me answering the question: what happens next? I’ve started to think out 3-4 chapters ahead. (If you think there have been plot twists so far, ha! You ain’t seen nothing yet!). Since I’m setting up an epic ending in my head at least, I’d maybe better just write the thing as a story instead of doling it out as faux flash fiction….
 But I didn’t want to leave, not without the team. I’d been chosen to be teamed after Command had put me back together, after I had almost died getting Lt. Popec out when the Belemnoids had overrun us on Omicron Velorum. It was stupid, my heads up was telling me he was a goner, beyond any help I could offer, but I refused to believe it.