
Bits of the following have appeared in the past couple posts on this current coronavirus kerfuffle; for clarity and reference sake, thought I’d put them all in one place. Nothing original here, just compiling the information in one key place.
I plan to stop posting on this for the next 2-3 weeks, at which time it should be clear if I’m wrong or if I’m right. I will then crow/eat crow, depending.
Data or ‘Facts’
Before one can start talking about numbers, what exactly one is counting should be spelled out. This is called ‘being reasonable’ or ‘the scientific method.’ Note that all the dreadful numbers, death rates, how fast the virus is spreading, how infectious and deadly it is, all hinge on these few numbers. Knowing how they are created and measured is therefore critical to understanding what is going on.
Infected: Ideally, we should only count a person as infected if they have been tested for the infection at least twice. The unknown but almost certainly high number of false positives makes testing only once imprudent.
In reality, we do not now and never will know the number of people infected with the virus. It seems many people infected, possibly as high as one half, have no symptoms. They feel fine, don’t go to the doctor, and, except in unusual cases such as cruise ships and NBA teams, don’t get tested. It is from those unusual cases that the information that about half of infections show no symptoms, e.g., “Nearly half of Diamond Princess cruise ship passengers and crew who had coronavirus were asymptomatic when tested, CDC report says”
Of the 712 passengers and crew members of the ship who tested positive for coronavirus, 331 — or 46.5% — were asymptomatic at the time of testing, the CDC said.The agency said that the high rate of asymptomatic infections could partly explain the high rate of infection among cruise ship passengers and crew.
[Iceland’s chief epidemiologist Thorolfur] Guðnason is quoted here
https://futurism.com/neoscope/half-coronavirus-carriers-no-symptoms as saying “Early results from deCode Genetics indicate that a low proportion of the general population has contracted the virus and that about half of those who tested positive are non-symptomatic.”.
hat tip to Foxfier
Point #1: Keep in mind that nobody knows how many people are infected, since asymptomatic people will never get tested except in somewhat unusual circumstances, and that it’s possible half or more of the people infected never get sick. The numbers of infected you hear or read are the outputs of models – not data – or otherwise pulled out of thin air.
Cases: Again, ideally, a case of COVID 19 infection should mean a situation where a person was tested at least twice and found to have the infection.
In reality, it appears many cases of COVID 19 infection are diagnoses without benefit of testing. In China, many cases of COVID 19 were diagnosed based on symptoms and CT scans:
On Feb. 12, the national health committee announced that it was changing the way cases were counted in Hubei province. People with symptoms of the disease and with evidence of pneumonia on a CT scan but who had not been tested for presence of the virus — in other words, people who had a clinical diagnosis — would be added to the list of cases.
That day, the country reported a massive increase in cases — over 15,000. But since then, the daily numbers have tumbled. On Wednesday, China announced it was reverting to reporting laboratory-confirmed cases only. When the National Health Committee issued its update for Wednesday, it reported a net increase of only 394 cases — the first time in weeks the daily case increase was under 1,000 cases.
That was then; now, in every country around the world, we have some largely unknown number of ‘unconfirmed cases’ – still counted as cases, but not confirmed by tests.
When diagnosis is based on symptoms, plus sometimes on travel and contact history, things get more and more uncertain: someone who has typical cold symptoms but has a friend who recently came back from a trip to China might become an ‘unconfirmed case’ and then, depending on the availability of tests, might not get tested right away. And that’s in First World countries.
Here are the CDC’s top symptoms:
- Fever
- Cough
- Shortness of breath
These symptoms are common to colds, flus, pneumonia, and probably more diseases.
Point #2: What a case *is* is not clearly defined, and is different over time and from country to country. Most important, cases are NOT equal to infections. Many, many more people may be infected than show up in case counts, however defined. DO NOT CONFUSE CASES WITH NUMBER OF PEOPLE INFECTED.
Deaths: Ideally, what we want to know is if COVID 19 killed somebody. Such a determination is clear, or as clear as it is likely to get, when a healthy person tests positive for the virus, and dies of respiratory failure after having progressed through some or all of the less serious symptoms.
Such cases are remarkably rare. Instead, we have COVID 19 deaths almost entirely restricted to vulnerable populations, people who have underlying health issues, including, especially, the overall weakness and infirmities associated with advanced age.
As in cases, it seems what constitutes a COVID 19 death may vary from country to country, and does not correspond to what a layman thinks when he hears ‘died of COVID 19’. Here’s how it is done in England:
Lee explains that in the U.K. if someone dies of a respiratory infection, the specific cause of that infection is not usually noted unless it is identified as a rare “notifiable disease,” not seasonal infections, like the flu.
“So the vast majority of respiratory deaths in the UK are recorded as bronchopneumonia, pneumonia, old age or a similar designation,” writes Lee. “We don’t really test for flu, or other seasonal infections. If the patient has, say, cancer, motor neurone disease or another serious disease, this will be recorded as the cause of death, even if the final illness was a respiratory infection.” The result, he says, is that U.K. certifications “normally under-record deaths due to respiratory infections.”
But COVID-19 is now included in the updated list of “notifiable diseases,” Lee explains. “That means every positive test for COVID-19 must be notified, in a way that it just would not be for flu or most other infections.” If any patient dies after having tested positive for COVID-19, “staff will have to record the COVID-19 designation on the death certificate — contrary to usual practice for most infections of this kind.” That might give COVID-19 “the appearance of it causing an increasing numbers of deaths, whether this is true or not,” writes Lee. (Read Lee’s op-ed here.)
Similar practices, or practices with the same result of over reporting deaths, seem to prevail elsewhere around the world. New guidelines for the US on how to fill out the cause of death on death certificates were released just yesterday. Minnesota Public Radio says “But new guidelines from the National Center for Health Statistics, which Minnesota follows, will err on the side of pinning more deaths on COVID-19, at least provisionally.”
Point #3: What the medical reporting means by a COVID 19 death is not what we commoners mean by it. As reported, a ‘death’ means ‘died while infected with COVID 19’ not ‘died OF a COVID 19 infection.’
Numbers and Percentages
The first thing to note, and the thing to keep in mind, is the vast amount of uncertainty in all this. We don’t know, and are very unlikely to ever know, how many people are infected with this virus. The number of cases can, and repeatedly has, shifted as the definition of what constitutes a ‘case’ has shifted. Deaths are in the same boat: Yesterday, for example, France added 884 deaths from some unknown number of cases in nursing homes, since they had not been counting deaths and, presumably, cases, from all their nursing homes up to that point. So, a major locus of coronavirus deaths – nursing homes, full of precisely the most vulnerable population – is not (they’re still counting it up) accurately included in the reported totals.
It would beggar belief to think France’s counting issues are unique or even rare.
Let’s revisit the key numbers:
How many people are or have been infected with the coronavirus so far? What is the peak likely to be? The honest if uncomfortable answer is: nobody knows. Yet, all sorts of numbers, ratios, and percentages that include some guestimate of the number of infected people get tossed out as if they are facts, or at least, strong enough guesses that policymakers are urged to impose martial law and cripple the economy based on them. One such estimate, as discussed here, was that 200 million Americans would get infected over the next 200 days. Baked into this number is the assumption that 100% of people are susceptible to infection.
Are we? On the Diamond Princess, only 18% of the people on board got infected; in Iceland, only about 6% got infected. These are places where something like a population was tested; all the national numbers you hear, like Italy’s or China’s, are almost entirely based on tests administered to a tiny subset of people with symptoms or with exposure to people with symptoms. We would expect much higher infections rates as determined by tests when all your test subjects are only people who you have good reason to think have the disease.
So, assuming 200 million infected people in the US, 60% of the population, is ridiculous. Then, applying a death rate based on one subset of cases, the author projects 11 million deaths. This scary scenario is created by applying a ratio of deaths to cases to a projection of number of infections pulled out of a hat. For about a week, this number – 11 million dead Americans if we don’t act now! – was treated as Gospel; then it became more like 500,000 dead Americans, despite actions being taken not nearly as drastically nor as quickly as demanded. Now? I’m still hearing numbers in the neighborhood of 250,000. Do not be surprised if the worse case numbers bandied about fall under 100,000, or, as I like to say, bad flu season level, over the next 2-3 weeks as Spring kicks into gear. We will pretend, often willingly, that we didn’t wildly overreact based on 11 million dead! and that we only had, say, 50,000 dead because we took such admirable, if extreme, actions as fast as we did.
We keep hearing about outrageous and terrifying death rates from COVID 19 infections: 4.5% in China, 11% in Italy, even 2.5% here in the US. Rarely do we hear it discussed that these are *CASE* fatality rates (CFR) NOT the percentage of people infected with the virus who die from it. The CFR DOES NOT represent our risk of dying if we catch the virus; rather, it expresses the risk of someone identified as a case having COVID 19 show up on his death certificate. That risk is much higher than your or my risk of dying from COVID 19.
To get some idea of our real risk of death from COVID 19, we’d need a better estimate of the number of people infected versus the number of cases. Then, we’d want to reduce the number of deaths to include only those where COVID 19 was the primary cause of death. Then, we’d have a number – inescapably, an estimate – that says how risky this whole plague is to the average Joe.
Can we do this? At least, get closer to reality than the CFR? All is not hopeless: we can, over time, refine our guess by intelligently comparing them to reality, or at least to much harder numbers.
Let’s start with the asymptomatic cases: about 50% of those who test positive in the general population (as in Iceland) for the virus show no symptoms. Applying this knowledge to the cases numbers means we can double the number of cases: if as many people who are infected show no symptoms as do show symptoms, and asymptomatic people are very unlikely to get tested and therefore show up as ‘cases’, that means there are (at least – more to come) twice as many infections as cases.
Next, the vast majority of cases show only mild symptoms:
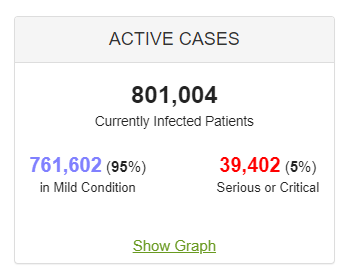
Mild symptoms are largely indistinguishable from common cold or flu symptoms, as we saw above. So, how many people go to the doctor when they have the sniffles or a low fever? Compared to how many people just pop a couple of Advil, call in sick and climb back into bed? Or even take some Dayquil and go to work? Now, imagine you are a member of a less affluent society than ours: do you go to the doctor for what looks like the common flu?
So I would suggest that at least as many infected people with mild symptoms don’t end up as cases as do. This would push our infected estimate up to 4 times the number of cases, under the assumption that there are as many asymptomatic infections as symptomatic ones. This cut our real death rate to 1/4 of the CFR, or from 2.5% to 0.6% in the US.
(This also means only 1.25% – that’s 1/4 of 5% – of people infected with the virus end up with serious symptoms. 98.75% have mild or no symptoms.)
But that’s still not enough, again according to Dr. Lee cited above (He’s using British numbers for a couple weeks ago):
Also, we’re only dealing with those COVID-19 cases that have made people sick enough or worried enough to get tested. There will be many more unaware that they have the virus, with either no symptoms, or mild ones.
That’s why, when Britain had 590 diagnosed cases, Sir Patrick Vallance, the government’s chief scientific adviser, suggested that the real figure was probably between 5,000 and 10,000 cases, 10 to 20 times higher. If he’s right, the headline death rate due to this virus is likely to be 10 to 20 times lower, say 0.25 percent to 0.5 percent. That puts the COVID-19 mortality rate in the range associated with infections like flu.
Spectator
If Sir Patrick is even a little correct, and we’re only off around one order of magnitude, real death rate will be 10% of the CDR – 0.25% in the US, well within common flu range.
And this counts everyone with COVID 19 on their death certificate! Which means we’d need to push that number down some more. How much? I’ve heard estimates of as little as 11-12% of of official COVID 19 deaths where the viral infection caused or seriously contributed to death, but alas, I can’t find the reference now. The point remains: given all the other uncertainty and out and out misrepresentations of the numbers, even if the reporting inconsistency is small, COVID 19 remains, at worst, a little more deadly than a routine flu.
But what about…
“1 out of every 6 people infected with COVID 19 get permanent lung damage.“
You mean, one out 6 of the 1.25% of people with a coronavirus infection who show serious symptoms? Surely this can’t mean that 1 out of 6 asymptomatic people – that’s 1/2, remember – suffer such damage? When? Without any symptoms? Or even that 1 out of every 6 people with mild symptoms? Their mild symptoms end up causing serious lung damage?
If this claim is, as I suspect it is, based on people with serious symptoms, 1 out of 6 our of 1.25% would be 1 out of every 500 people infected with the virus. We’re getting into ‘killed by a tornado’ levels of unlikelihood. I’d like to see the details of this claim – 5 minutes of web searching pulled up nothing.
“Hospitals overrun! Healthcare collapsing!“
Did you know that Italy has a history of being overwhelmed by respiratory cases? They have had higher than typical death rates from flu outbreaks over much of the last decade.
Did you know Alabama had to declare a state of emergency in 2018 when a flu outbreak threatened to overwhelm their health care system?
Did you know NYC was home to the #WuhanStrong movement right before the outbreak got bad, where people were encouraged to hug and otherwise fraternize with those who had recently been to or come from China, in order to prove they were not evil raaacists like the Orange Man? This might figure into their problems.
In general, all healthcare everywhere makes capacity trade-offs. No one can afford to build and staff a hospital such that no emergency will ever catch them underprepared. They take an educated guess at what they’ll need, adjust it by what they can afford, try to coordinate with surrounding systmes, and hope for the best. And then, hey screw it up, because they are human. A local example: we in California know it is almost certainly just a matter of time before the next big earthquake or ARkStorm. You think our healthcare system could handle that? I’ll spare you the suspense: no, it could not. BUT – there’s no way our healthcare system could be maintained for years on end with the sort of capacity such disasters would demand. So they do what they can, and hope for the best.
“exponential growth!”
Not really.

The red line is 1, meaning a linear type increase. The current trend, if you can even claim to make it out, seems pretty flat, with occasional dips below the line. What is clear is a lack of any clear exponential explosion.
Check back in 2-3 weeks. If this virus acts like a typical air- and surface-borne virus, sunshine and nice weather will be the end of it (with a possible reprise in the fall). But, while it is tragic when people die, you’d be a lot better off getting some exercise and cutting out some calories than in worrying yourself over this virus.
Of course, I could be wrong. I’m just a numbers guy. This thing could explode tomorrow, mutate into something really deadly, and kill us all. It just doesn’t look like it will, from the available evidence and history.
So, WHY is everybody panicking over this? WHY is dominating the news and causing us to commit economic seppuku? Those are very good questions.

It’s God’s fault.
He does like bats. He made a boatload of them.
I have noticed that these growth curves look linear with just a hint of exponential ie a slight bend
Yes, very much. For the last 2 weeks, worldwide, the factor has been hovering right around 1, slightly above. 1 is flat, linear growth; anything north of 1 is exponential growth. Even 1.1 will eventually explode, but it takes more time to see it. If it falls below 1 for a week or so running, this thing is pretty much over – always, with the caveat that it is a typical viral infection that does not survive nice sunny weather well. I could be wrong. I like the way things are trending.
“Growth factor” is grossly misused at the end of the article. You calculate (or use) the relative change on the number of *new* cases. You *should* be using “total_cases_today / total_cases_yesterday”; if *that* number is > 1 (and constant), you have exponential growth, for values less than 1 you have exponential decay, and if the factor is exactly 1, you have no growth (i.e., just enough new infections to make up for those who recovered or died).
For the total number of current infections to go to zero, your “new cases growth factor” would have to become negative.
Hey, just go to worldometers.info, pick a country or state and look at the graphs for infected persons. There is a button to switch to logarithmic scale (standard is linear). On the log scale, straight exponential growth with the same growth factor is a straight line, and the incline (rise over run) is the growth factor. If the line bends upwards on the log scale, growth is super-exponential (_bad_), if it bends below a straight line, the growth factor grows smaller. A horizontal line signifies a growth factor of 1.0 (just “replacement” of the dead and recovered).
All that said, the pricipan error at the end of your article is using “new cases” instead of “active cases” or even “total cases”.
Cheers,
Felix.
Seems like your definition will classify a linear growth as exponential.
I think you refer to one of two things that I noted:
Either to logarithmic scale where a straight line indeed shows exponential growth, and which makes it easy to tell faster-than-exponential from slower-than-exponential;
or to my unhappiness with the “growth factor” calculated from day-over-day-increases. That is technically related to the forward difference (“first-order forward difference”) of those increases, and since they are themselves (related to) the first-order forward differences of the underlying total count of infected, they represent the second-order differences of the actual numbers of infected. This finite-difference equivalent of a second derivative indicates whether growth accelerates or is reduced, but it does not say whether there is growth or not.
I apologise for the clumsy wording; English is certainly difficult enough without having to recall the proper terms for concenpts that I only ever learned in German. Sorry!
Felix.
Some of those people tested on Diamond Princess and in Iceland and found not to have the virus may have had it and recovered- afaik antibody tests weren’t carried out.
Also,the object of all the social distancing etc. seems.to be to reduce the number of cases to what the healthcare system can manage at any one time by prolonging the outbreak. If so it would be a good idea, once the flu season is over thus freeing up a lot of beds,to encourage everyone to hug each other. This would get the Covid outbreak over during the summer when the healthcare system has capacity and before the next flu season when it won’t have.
I had to keep working when everyone else was self-quarantining at home. Just for a week, but it was enough.
I got sick, with a fever, exhaustion, cough, but without any runny nose or sneezing that usually comes with seasonal sickness. At the height of my illness, I felt like I couldn’t breath. My lungs were burning and it felt like there were metal bands around my chest, and I was coughing until I saw stars. I’ve had pneumonia before and that is what it felt like.
I went to the urgent care clinic. They tested me for flu and strep, and told me I had neither. Then they told me to have a nice day, because they didn’t have any COVID tests, although the doctor admitted it was likely I had the virus. When I told him (for the third time) that I was panicking because I felt like I couldn’t breathe and I needed help, he told me to go to the ER immediately.
The ER was fairly empty. I went through triage and was sitting in a bed in a room #2 in about 5 minutes. I didn’t see another patient my entire time there. They took blood, did a chest xray, listened to my breathing, took urine for more tests, came back and took MORE blood for more tests, and told me that everything looked great – I had no signs of heart attack, no pneumonia, and in fact that only thing that was abnormal was “elevated white blood cell count”.
The doctor then told me that he felt it was 99% likely that I had the virus (Speaking to me through an ipad because he didn’t want to be in the room with me), but that he was not permitted to test me because he is only allowed to use a test on people who are being admitted for pneumonia, or someone who shows symptoms and has traveled recently.
“Why does my chest hurt so bad, then? What do I do?” I asked. I was still in a lot of pain and a lot of panic. Amazing what feeling like you can’t breath will do to the human brain. His answer: “You don’t even have a fever right now. Go home, go to bed, absolutely come back if you start running a high fever or if the symptoms get worse.” A nurse came, took out my IV, gave me paperwork to sign, and I was out the door.
Imagine only giving tests to people who were being admitted for pneumonia? How badly does that skew the numbers?
(BTW, I’m fully recovered… or, at least, 95% recovered. After the one day of lung-based agony, I woke the next day feeling much better, and every day after has been better than the one before. I’m staying home and living off the supplies that I prudently keep on hand for just such an event. The loss of income (I was a contractor) sucks, so I’ll add a personal plug – I have a set of well reviewed books for sale at https://www.amazon.com/gp/product/B07QJS959F if anyone wants to help out.)
> Imagine only giving tests to people who were being admitted for pneumonia?
> How badly does that skew the numbers?
Excellent point. Actually, it’s the other way round; we should just test everybody if we want to have hard numbers on prevalence, mortality and so on, just like our kind host says.
As for individuals, a medical test of any sort only makes sense if the treatent is different depending on the outcome. Until there is a specific medication for SARS-nCov-2 infections, the salient fact about your pneumonia is that it was (presumably) not bacterial, which means that natibiotics will either do nothing or at best prevent an opportunistic secondary infection.
I am happy to hear that you are well on your way to a full recovery; I recall pneumonia as something extremely unpleasant.
Felix.
Another puzzler (at least to me) is the cases in the very remote rural areas of the USA. It’s like it’s in every county in the country with at least a handful of “positive” confirmed cases. Considering the lock down and safe distance dates, it’s hard to fathom that the virus got into these remote area’s AFTER the lock down. Ergo, the virus was here BEFORE the lock down orders and got way out into the rural areas. Hence, the question arising, when did the virus really arrive in the USA? Fall of 2019? The mass influx of international students arrive to school in the fall? Anyways, maybe you, the numbers guy, can put some reasoning why we see these cases in the very remote rural areas – just a handful to be sure, but they are “confirmed” positive nonetheless.
Hey, no problemo. I hear tours of N. Italy are real cheap right now. Why don’t you signal your virtue with a 2 week tour and tell us how it went when you get back? Since “it’s only the flu”and only 1 in 1000 get it, that shouldn’t be a problem, right?
Sounds like fun. Alas, can’t get away right now.
Let’s look at the numbers: 60M Italians, 120K cases; using my back of the envelope X4 adjustments, about 500K actual infections: .8% infection rate; 98.75% it would be asymptomatic or mild if I got it. Struck by lightning level risk of anything bad happening because of the Kung Flu. Plus, I’m healthy. So now we’re getting shark attack level risk.
So, should a healthy adult take a trip to Italy, maybe avoid hospitals and nursing homes (horrible disease vectors, those) and save a ton of money? Sure!
> 60M Italians, 120K cases; using my back of the envelope X4 adjustments,
> about 500K actual infections: .8% infection rate
If anything, I think you are underestimating the number of unreported cases and overestimating the mortality. Here are a few more numbers concerning Italy (Spain is similarly situated) which may explain the observed CFR there:
median and average population age is somwthing like 15 to 20 years higher than US or even Germany
ICU beds per 100k inhabitants, not counting stopgaps now deployed: US—34+ (not counting burn ICUs), Germany—28 to 32, depending on who counts; Austria—13; Italy and Spain—6. Yes, less than a fifth of the US or Germany.
Sorry for bringing politics into this, but when there is a single-payer system, or a single point of control for a multi-payer system, expensive ICUs (and curses and doctors) are replaced by cheap triage guidelines. Sky news (UK) interviewed a Spanish hospitalist yesterday who clearly admitted that if you are over 60, you better recover on your own. Lovely.
Felix.
This has been a fascinating and enlightening discussion from the article thru the comments. Thanks all.
btw Felix, in your comment immediately above, I think you meant to say “nurses” but the more I thought about it, “curses” works, too. 😷
(Oops, and thanks!)
Just remember: Fauci’s LOW NUMBER was 100,000 dead Americans.
Low number. If we all do a swell job.
I have been saying all along if we hit that number I will admit to being wrong. This is me being nice, since to be as bad as the 1957 pandemic we’d need 300,000 or so dead, but to be fair I’ve been beating this drum awhile so let’s say my “wrong” number is 100,000.
I suspect 20 to 50 thousand.
Point two: NJ still does not have an epidemic.
The METROPOLITAN AREA does.
With cases rising by the hundreds and hundreds per day and deaths piling higher and higher, my county STILL has only 3 deaths (2, since one was a guy with covid who hit his head).
Two counties last I checked have NONE.
So why are we pretending the whole state is the metro area instead of quarantining that section?
I’m even willing to bet that Essex county doesn’t have an epidemic. Probably just Newark, but I haven’t checked this.
I’ve heard estimates of as little as 11-12% of of official COVID 19 deaths where the viral infection caused or seriously contributed to death, but alas, I can’t find the reference now.
That’s the doctor in Italy who is with their CDC (can’t remember the exact ranking/position) explaining why they have so many cases that don’t make sense.
Do you have a link? I couldn’t find it yesterday.
https://www.liberoquotidiano.it/news/italia/21423660/coronavirus_walter_ricciardi_italia_morti_solo_minoranza_causa_vera_epidemia.html
Google translate: https://translate.google.com/translate?sl=auto&tl=en&u=https%3A%2F%2Fwww.liberoquotidiano.it%2Fnews%2Fitalia%2F21423660%2Fcoronavirus_walter_ricciardi_italia_morti_solo_minoranza_causa_vera_epidemia.html
Walter Ricciardi was at the time the health minister’s scientific consultant for the Covid-19 epidemic. (He probably still has the job, but I didn’t check.) The article is dated Marchh 21st, 2020.
https://www.telegraph.co.uk/global-health/science-and-disease/have-many-coronavirus-patients-died-italy/
The Telegraph also based its reporting, at least partially, on Mr. Ricciardi. Dated March 23rd, 2020.
In France, where they just added deaths in long-term and geriatric care facilities to the totals, they didn’t bother to test; if you died in a home for the old, you are assumed to have died of Covid-19. If you die with pneumonia-like symptoms, the same goes.
thanks!
Nice analysis. I used a much different method of coming to a similar conclusion you did.
Using data from the CDC’s webpage, I calculated the average number of reported cases over (cumulative) onset cases to estimate the number of under reported infections each day for the U.S. This method suggests about 13-14 people out of 100 with the virus will be reported as a case, which consistently lowers the death rate between 0.30-0.40 percent.
Unfortunately the calculations for this estimate lag real-time data by about 11 days, which is roughly how long the reported incubation period is, so as of April 6, there is only reliable data up to March 25 for onset cases.
Perhaps the most significant factor missing from my own analysis is an estimate of how many of the reported deaths were incorrectly attributed primarily to COVID-19. Any number fewer than what is officially reported would further reduce my estimated death rate of 0.30-0.40%, but probably not by 88% as suggested by Dr. Ricciardi due to likely differences in recording cause of death between U.S. and Italy.
All together, my opinion is that the U.S. is experiencing a heavy flu season compounded by the addition of COVID-19.
Also, as of today, I believe the U.S. may have reached their peak on Friday. I think Tuesday’s and Wednesday’s data will confirm or disconfirm.
For those of you who want to look at the data I used, it is derived from this page: https://www.cdc.gov/coronavirus/2019-ncov/cases-updates/cases-in-us.html
Thanks,
The Janitor